


It’s one thing to look at your soil tests from one field and compare them to your yield map in that field, but what if you could analyze all the samples you took in a year and compare them to this year’s and last year’s yield across your entire farm at once?

SOMETHING LIKE THAT WOULD BE AN IMMENSELY POWERFUL TOOL TO HELP PLAN YOUR NUTRIENT APPLICATIONS!
Now, we have integrated that capability into VRAFY, and this knowledge is just two clicks away.
As more people have joined VRAFY, I’ve seen a lot of different farms represented, but some overall trends have begun to emerge. For example, almost all of the customers I work with are showing strong yield correlations on their farms related to zinc and copper, both individually and combined.
Over the past several years, there has been a long-term upward trend in yields along with a concentration of mostly N, P, and K fertilization – with just small additions of Zn and Cu, IF ANY. As a consequence, I have begun recommending larger amounts of zinc sulfate and copper sulfate to start building these elements up to adequate amounts in the soil profiles of the farms I work with.

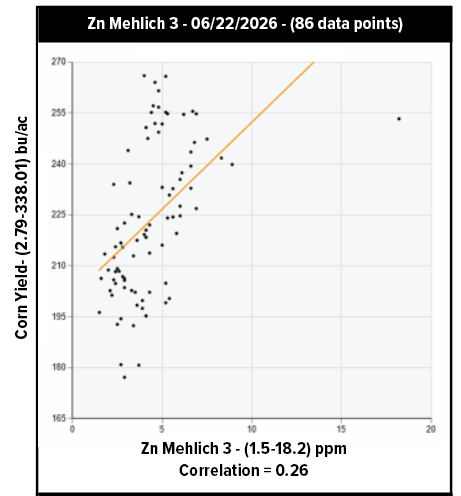
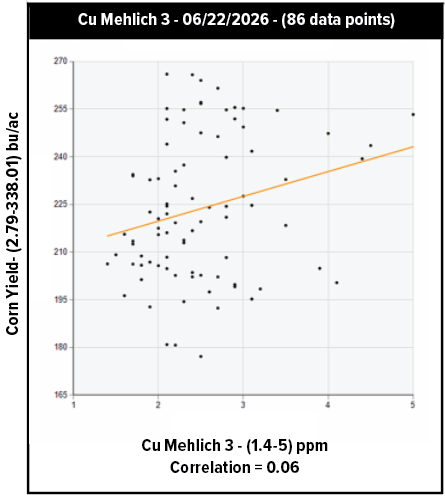
On the right is an example of what the VRAFY’s SPY (Soil Point to Yield) analysis report looks like for parts per million of zinc and copper to bushels of corn yield per acre.
Depending on available soils data, the SPY analysis can put out up to 40 charts just like this, showing levels of individual elements and ratios of one to another. In the examples to the right, it appears that zinc is an issue more than copper. Taking a look at the high yield areas, you can see that none of the higher yields came from areas where zinc was less than 5 ppm.
With this knowledge in mind, we can now make a more comprehensive fertilizer plan for the entire farm.
In VRAFY, there are 200+ available equations to produce prescription (Rx) maps, and one I like to use regularly is the balance of phosphorus to zinc.
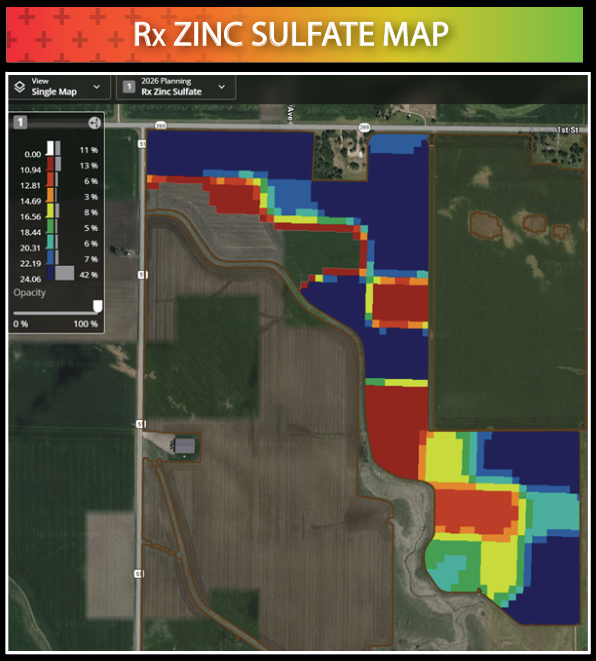
In the upper image to the right, we have higher P levels and the Zn need was a bit of a concern, so we ran the following zinc sulfate application Rx Map (0-25 lbs/a) correlated to phosphate balance to get an idea of where zinc would be most needed in the field.
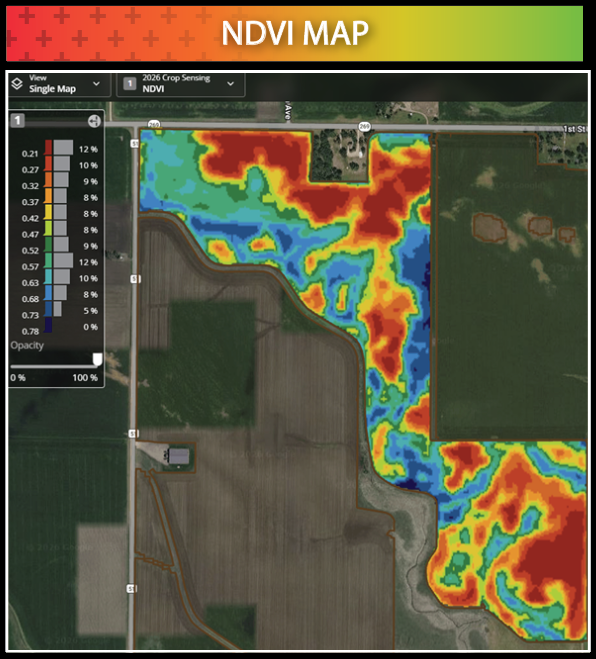
This was further confirmed by the satellite NDVI map showing the crop condition at the end of the season.
Comparing the two maps on the right, notice the strong areas of correlation where areas recommending high zinc applications correspond to lower end-of-season crop condition almost 100% of the time.
USING THIS WHOLE-FARM ANALYSIS METHOD IN VRAFY, YOU CAN SEE WHAT’S HAPPENING IN YOUR FIELDS ON A GLOBAL LEVEL.
We spend a great deal of time collecting soil samples, learning how to read soil tests, and determining the best timing of when to pull those tests. With the ability to take that data and connect those results to actual yields on your farm by crop – while adding more data layers like satellite imagery – VRAFY becomes a powerful and indispensable tool to help you decide the next steps of your fertility plan and where to allocate your fertility budget where it will be the most effective.

If you have any questions on how the SPY analysis works and for information on all the ways the analytical tools in VRAFY can be applied to your operation to make your nutrient strategy more efficient, talk to your Hefty Agronomist.