IT SURE WAS ON OURS!
- We were able to plant much earlier than the last few years.
- It turned cold after planting, but then warmed up so we accumulated A LOT more GDD’s (Growing Degree Days) than normal.
- The last half of the season turned very dry.
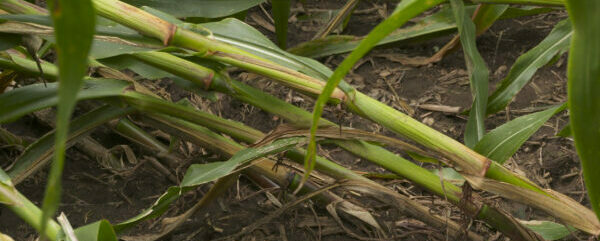
- We had an early wind storm in June that caused some lodging and stalk issues in the area.
That’s part of the story, for just one area of the country. How about in your area? I ask that because you have to take a lot into account when you look at yield trial results in plots and even in side-by-sides through a field. Here are some of the things to watch for when evaluating plot data for 2020.

Confidence Rating
One of the first things to look at in BIG plots is the standard deviation or the “confidence rating.” To the right is an example from a 2020 FIRST Trial in Mansfield, SD.

The LSD (Least Significant Difference) between hybrids in this plot is 16.1 bushels at the 0.10 or 90% confidence level. So for both hybrids to be within a bushel, that’s saying they are statistically equal or at least not statistically different. What I’d also call out is that maturities are clearly different with one company labeling a corn hybrid as 95-day with 15.7% harvest moisture; compare that to another company calling a hybrid 94-day with 18.1% moisture. With all that moisture to take out of the one hybrid, it caused it to drop in the profitability rankings.
So before you say one hybrid is a better yielder all the time than the other one, look at the LSD to see if they’re even statistically different.
Maturity Differences
Speaking of maturity differences, these can affect much more than just harvest moisture. Odds are very good that flowering dates were different, too. Therefore, the timing of heat and even wind events could lead to an advantage for one hybrid over the other that may never happen again. Greensnap and even wind lodging scores could indicate this with one hybrid winning in one plot and losing big in another, so always take those things into account and look at multiple plots and areas.
Plot Notes
With any yield information you look at, be sure to watch for notes left by the person managing the plot throughout the year. They will often talk about disease pressure, drownouts, seed quality issues (especially with brand new hybrids/varieties), planter issues, and any equipment errors – or as I like to say, “iron blight issues” – in the field. They may also comment on soil or fertility variability. With drought conditions in many areas this year, if a hybrid was in the low ground that held moisture versus a hilltop that dried out, it made a huge swing in the yield.
Late Harvest and Dry Seed
2020 saw many plots coming out very early, yet still coming out really dry. When soybeans get harvested at 8% or corn comes out at 14-16%, that’s not really a good thing in a plot situation. You’ve lost your real-world comparisons that showed maturity differences. You’ve also lost yield, most obviously with the soybeans.
Here’s an easy example. If one soybean variety yielded 60 bushels per acre at 13% harvest moisture and another variety yielded 59.5 bushels at 8% moisture, which one really won? Add back the 5% moisture times 1.5% shrink. That’s 7.5%, which puts roughly 4.5 more bushels on the drier competitor! Be cautious and critical when looking at late-harvested plots or very dry grain results.
Summary
The takeaway is just like we’d always recommend: be sure to plant lots of hybrids, and don’t get caught up in who “won” a specific plot. Spread your maturities out and diversify genetics. This year’s plot winner is very unlikely to be the best variety across your whole farm next year.
